← Back to overview

How it works

A step-by-step walkthrough of what you actually see, from opening a project to running, editing, and evaluating it. Every screenshot on this page is a real screenshot of the extension running against the bundled fixtures/sample-langgraph-project, not a mockup.

1

Open the Agent Map

Open the root folder of a LangGraph or CrewAI project, or run Agentic: Open Sample Project from the Command Palette to try a bundled sample instantly, then open the graph view.
  1. Open the Command Palette: Cmd/Ctrl+Shift+P.
  2. Run Agentic: Open Agent Map.
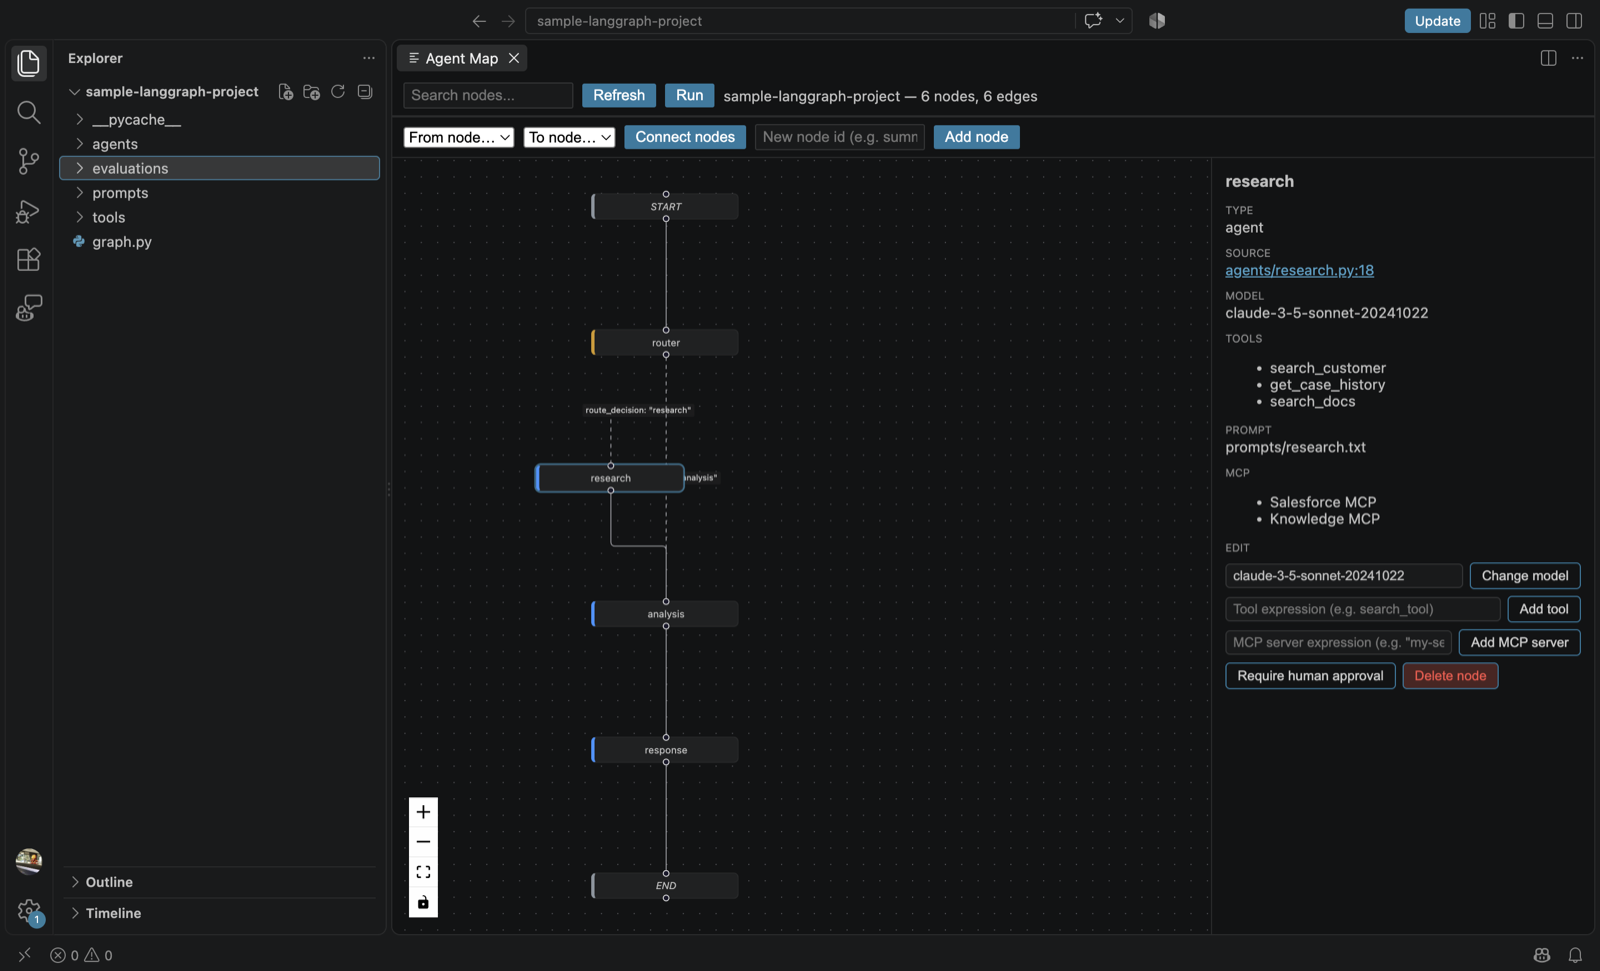
  3. The extension statically analyzes your source and renders every node, edge, conditional branch, and entry point — no configuration needed.
Agent Map graph view showing a LangGraph project's nodes and edges, with an inspector panel open on the right

The full Agent Map for sample-langgraph-project: 6 nodes, 6 edges, themed to match the editor.

2

Inspect real metadata

Click any node to open its inspector panel on the right. Everything shown here is parsed directly from your source, never guessed — if a field can't be confirmed, it's left out.

  1. Click a node, for example research.
  2. The panel shows its type, model, tools, prompt file, and any MCP servers it uses.
  3. Click the source link (agents/research.py:18) to jump straight to that exact line in your editor.
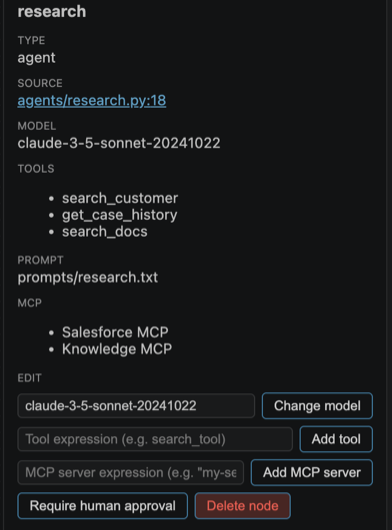
Node inspector panel showing type, source file:line, model, tools, prompt, and MCP servers for the research node

Real, sourced metadata for a single node — model, tools, prompt file, and MCP servers.

3

Run and replay

The Run button in the toolbar executes the real, compiled LangGraph — not a simulation.

  1. Click Run in the toolbar (or run Agentic: Run Agent from the Command Palette).
  2. Provide input for the run; the extension executes your actual compiled graph via Python and records a per-node trace as it goes.
  3. Once finished, click any node in the trace to replay execution from that exact point, with the same recorded state.
Agent Map toolbar showing Search nodes, Refresh, and Run buttons

The Run button in the graph toolbar, next to search and refresh.

4

Edit the graph visually

Changes made in the graph are written back to your real Python source, not kept as an in-memory diagram.

  1. Use From node / To node / Connect nodes in the toolbar to wire up a new edge, or type a new node id and click Add node.
  2. With a node selected, use the inspector's Edit section to Change model, Add tool, Add MCP server, require human approval, or delete the node.
  3. Every action edits the actual source file behind that node — open it afterward and the change is right there.
Toolbar controls for connecting nodes and adding a new node by id

Wiring up a new edge or adding a node directly from the toolbar.

5

Evaluate and catch regressions

Run a dataset of test cases against your graph and get flagged the moment something that used to pass starts failing.

  1. Write a JSON dataset of input/expected-output cases — open the bundled LangGraph sample project (Agentic: Open Sample Project → "LangGraph sample project") to see a real example at evaluations/smoke.json, or generate one with Agentic: Create Evaluation Dataset. The shape is:
    {
      "name": "smoke-test",
      "evaluator": { "kind": "contains" },
      "cases": [
        { "id": "greeting", "input": { "question": "hello" }, "expected": "\"response\"" }
      ]
    }
    evaluator.kind controls how expected is compared against the actual output: "exactMatch" (default, strict equality — rarely useful for LLM output), "contains" (checks a substring, the most common choice), "noError" (just checks the run didn't throw), or "custom" (point modulePath at your own Node module exporting a comparison function for arbitrary logic).
  2. Run Agentic: Run Evaluation from the Command Palette.
  3. Get a per-case pass/fail report with real latencies, plus a callout if a previously-passing case now fails — a regression. Results print to the "Agentic: Evaluations" Output panel (View → Output, then pick it from the dropdown) — that's where to look after running the command.
6

Ask the Agent Architecture Copilot

10 commands that analyze your real graph and code. LLM-backed answers always cite real file:line locations and say "I don't know" rather than invent one.

  1. Open the Command Palette and run any Agentic: copilot command, for example Agentic: Find Missing Error Handling.
  2. Results print to the Output panel, under the Agentic: Copilot channel.
  3. Every finding cites the actual node name and file:line it came from — click through to verify it yourself.
Output panel showing the Agentic: Find Missing Error Handling command result, listing real nodes and file:line locations with no try/except handling

Real output from Agentic: Find Missing Error Handling, citing real nodes and file:line locations.

Ready to try it on your own project? Install from the Marketplace.